今天,股市连续第四天疯涨,直接要冲击所有的重要阻力线。 我很不习惯这种突然的变化,我宁可把它看成创新低后的反弹,而不是因为基本面改变了。
也许,新总统有很多经济刺激计划,可是,那么多的lay off, 对市场的影响,就完全没有了?
这几天,量不断减小,可能是因为holiday的原因,也可能不是,看 不准。
下车早了,但是,这是双刃剑,经验不足,对天量新低反弹的力度,没有足够的认识。 而且,在trend没有真正broken的情况下,提前获利了。
关于卖出,应该采用trend信号, 而不是osilator, MA或者是Band可能效果更好些,在结合关键阻力位置,进行Stop的设置。
周五不用看盘了,等周一再看吧。 周日晚上,总结一下一些股票的图形,定一下下周的操作策略。
Wednesday, November 26, 2008
Tuesday, November 25, 2008


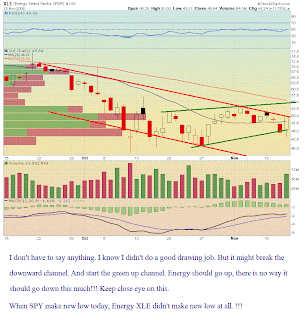
11/25/2008: EGY and XLE, Energy


Energy should bottom out. But the chart didn't confirm this. So just watch.


Friday, November 21, 2008
11/21/2008: 记住今天, 成功的catch了反转!记住
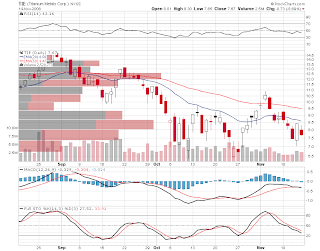
今天,是历史性的突破, 一定要记住今天。 最后一个小时的反转, 再次出现了Strong Right的信号,这次, 无论从时间,还是价格,成交量,都是巨大的。同时进了TIE和EGY,
TIE一直在看,基本上扬10%, EGY也是10%。 都大于大盘。 而距离上一个阻力位置,还有15%-20%的上扬区间。所以,要看大盘SPY能不能有效突破到85左右再掉头向下。
看图吧,图上都写了,这次的成功
1. 事先准备好了,如果反弹,应该如何操作
2. 对反弹的strong right信号,非常敏感, 马上反应了。
3. 对TIE, EGY,下单之前, 进行了STOP位置的计算,风险在3-5%左右,而上扬获利8-10%。 上扬概率很大。
好了,顺风顺水,成功了一次。
下面的问题,如何获得利润?
看下图,首先,计算了可能的阻力位置。 那么,EGY要看XLE, XLE要突破48, 还有10%要走,
TIE只好看SPY了, SPY也还有8%要走。 这是向上。 如果向上,将Stop Order 上移, 保证手续费。
如果下降,STOP还设置在原来的位置。如果STOP OUT, 进Ultra Short SPY, Energy, 和 Financial的ETF, 市场应该继续向下10%, SP500 去7000,DOW去7000.
记住今天!!!


Thursday, November 20, 2008
11/20/2008: 6年大底,破了!!!!
今天,2000-2002的熊市大底,终于被破了,意料之中,只是,来的时候,还是没做好心里准备,更没有做好trading 的准备。
对于trading, 一定要选符合trend的方向, 然后在support/resistance的area,进行相应的操作。要相信自己。如果,操作按照自己的计划,还是失败了,可以再分析原因。但是,一定要consistent.
其实,三大汽车的问题,也是知道的,甚至GM4.8的时候,都想防火烧了,可惜,还是没进行。继续观察,学习。
要像狮子一样,为好的猎物,耐心等候,机会总会来的。好好看看下面的三张图,都写在上面了。


对于trading, 一定要选符合trend的方向, 然后在support/resistance的area,进行相应的操作。要相信自己。如果,操作按照自己的计划,还是失败了,可以再分析原因。但是,一定要consistent.
其实,三大汽车的问题,也是知道的,甚至GM4.8的时候,都想防火烧了,可惜,还是没进行。继续观察,学习。
要像狮子一样,为好的猎物,耐心等候,机会总会来的。好好看看下面的三张图,都写在上面了。


Wednesday, November 19, 2008
11/19/2008, Dow破8000, 一些操作上的感想。
今天,做了写错误的操作,但是,坚定了原先的一些想法。
1. Always buy on support, and sell on resistance. We support break, it become resistance, sell the long position right below the support. We resistance break, it become support, cover short position right above resistance level.
2. Always clear about resistance and support, trend line. When trend is up, short should be fast, when trend is down, catch rebound should be fast. Because counter trend has more risk than follow trend.
3. Average down at the next support level is wrong. You can average down right below the support line for long position to prevent being shaken out, give yourself a second chance. But that is it! Then set the stop close the second entry place to cut loss short.
4. Follow the trend, Follow the trend!!!
5. Where is support? Previous lows that triggered rebound, previous volume congestion area, lower band trend line. What is resistance, previous high that trigger the reversal, previous volume congestion area, upper trend line.
6. Intermarket analysis. Use sector and SPY, DOW to check the individual stock's strength. Make sure your stock pick is stronger in the trend then the sector and whole market. Use BOND (TLT) to check money flow. When TLT suddenly go up, means money flow out of stock and goes to bond.
7. Should check other market strength indicator, such as AD, VIX, etc...
So many things. Look at the chart, see how many mistake you made, See what you did wrong and what you did right. Most important, after bought TIE, you start wishful thinking, ignored previous plan, wishing is will go up. Especially today, 6.95 is touched twice, give you the opportunity to cut the loss by selling on resistance, but you just hoping it will break the resistance and go up! Second time, a double top is about to form, so cut along the way when it is down, that is your last chance!!!
Alright, remember above words, those are not inconsistent. Instead, those words you know since you started learning stock for the last 2 month. But today you still failed to use what you learnt when you play the stock. No wishful thinking, ignore other people's opinion, just follow your own plan, your own judgement. Right or wrong, you will have a feeling!


Tuesday, November 18, 2008
11/18/2008 无聊的市场,锻炼心里
市场无限接近底部,反弹越来越没有力量,不知是不是牛们在积攒力量。 今天,就不上图了。
昨天,买了一点TIE, 7.25, 计划6.5 average down ,这样平均6.9, 在6.3左右Cut.
这样的计划好么? 我不知道? 今天收盘是6.85, 最低6.6。 有股票在手的时候,心情就不同,变得焦虑不安,不想cut. 心里上,放大一切牛的信号,缩小一切熊的信号。 要不得,要不得。
目前,对买入信号,还有点信心,不过,昨天7.0到7.3的up swing, 最终fail了, 但是,也不是cut的机会,昨天其实是买的对。
今天,一直向下, 6.5没到,就说明,原先的AD位置是对的,其实,如果突破6.5, 应该会更低些。不如吧stop设在6.39, 等到底部在接。
恩,这样吧, 根据大形式,如果大盘形式不好,新低没反弹,尽快割掉。 等待新低抄底。
哎,确实锻炼心里,不过,操作,心里,就是要锻炼的。 也要加紧学习,然后,back test 各种strategy. 现在,还没有比较相信的strategy, 当然心里没底了。
好吧,根据大盘形式,如果走势和大盘相当,大盘创新低,没反弹的话,快跑。
如果弱于大盘,而大盘震荡, 快跑。
如果强于大盘, 大盘向上,加仓, 大盘向下, 观望,跑或加仓???
Monday, November 17, 2008
11/17/2008: Ready for new low ???
同样,看图。 Are we ready for new lows?, Let's see what happened in the past week?
1. Unemployment rate to 6.5%, worst since 2001.
2. CC file chapter 11, Best BUY said it is the worst time ever.
3. GM can not survive, waiting government bail out
4. Citi Bank announce to lay off more than 50,000 employees
5. Treasure don't know how to spend 700B Dollars, congress furious.
....
There are more and more. Plus, China decided to step aside, probably reduce lending to the US.
Ok, let's tighten belt and see.
Plus:
1. Watch China market, it might get bottomed out.
2. Watch Energy, it might get bottomed out too.


Sunday, November 16, 2008
11/08-11/16 SPY, Engery, financial, etc
11/13, 大盘探底,引发3个小时, 10%rebound, 让我记忆犹新。 但是,日间翻转的时候,还是有一个很好的信号的,11/14, 同样信号出现了三次,大盘翻转了3次。 参见前两天的blog.
从十天,和两天图,SPY都处于很差的态势, 如果没有好的刺激,应该继续向下。 但是,似乎有些人看到的基本层面的变化,我却一点也没看见。 真另人沮丧。不过,可以根据关键阻力位置的突破情况,感受基本面的变化。不用在leader, 做个follower就可以了。
Energy, 正在悄悄筑底, 看下面的XLE图, 而同样,Financial, 正一步步向下。 看来,financial还有的跌,而关注Energy破阻力位置的情况。其实,应该看看什么个股,表现比板块强,就是板块涨10% ,它涨20%或更多。 TIE, 就是这样的例子。
看图吧,继续关注。。。


从十天,和两天图,SPY都处于很差的态势, 如果没有好的刺激,应该继续向下。 但是,似乎有些人看到的基本层面的变化,我却一点也没看见。 真另人沮丧。不过,可以根据关键阻力位置的突破情况,感受基本面的变化。不用在leader, 做个follower就可以了。
Energy, 正在悄悄筑底, 看下面的XLE图, 而同样,Financial, 正一步步向下。 看来,financial还有的跌,而关注Energy破阻力位置的情况。其实,应该看看什么个股,表现比板块强,就是板块涨10% ,它涨20%或更多。 TIE, 就是这样的例子。
看图吧,继续关注。。。


Friday, November 14, 2008
11/14/2008 第一次DT, 总结一下

图画的难看了一些。 昨天用"strong right" 看到了反弹,但是没跟。 今天开盘,10点的时候,就是一个“strong right”, 终于动作了。 都写在图上了,initial stop 92. 就是那个高点。 后来一直跟踪调整, 到12点半的时候,strigger了stop。 每股盈利1.5. 哈哈。
1点半的时候, "strong right"再次出现,这次,还是一个W,with higher low, 有了上午的鼓励,再次进入。没想到, 3点的时候,又一次"strong right", 在stop没trigger前,及时卖出。
太累了,没有反手跟进SDS, 就relax的看着"strong right"后的falling.
有几点心得:
1. 本来不想DT, 但是, CNBC说,现在一个星期的新闻,比原来一个月还多。 那,股市一天,等于原来一个星期。 而且,daily chart 上,一天就一个bar, P都没有。
2. Stop很重要, 很很重要。
3. 要手快,及时根据形式判断,不要犹豫, 信号说什么,就是什么。
4. 没有事先画可能的support和resistance, 不然,兴许profit会大些。
好了,学以致用,效果不错, 两天,4次信号都是对的。 What can I say!
对于TA的一些想法
我以前是一点也不相信TA, 主要的原因是觉得Future price make chart pattern, not chart pattern make future price. 所有的图和Indicator, 都是滞后的。 看到TA书里面各种没有经过测试的Pattern, 我就更加对TA不屑一顾。
最近,才开始真正接触TA, 才发现,以前的想法是对的,但是是偏激的。TA的好处和用处主要有以下几点:
1) TA是一个辅助的工具,给我们一个信心,在这个变换莫测的市场里,你必须相信些什么,才能有信心投入到市场里。 如果总是凭感觉,终究会失败。 没有信心,总是不能进入市场,永远也不能成功。
2) TA可以帮助我们分析市场参与者的心里, 市场还是有一些动量的,这些动量在图形上,结合Price & Volume的分析,是可以看出来的。 而大众的心里,make the chart pattern。 这些Pattern, 使我们,有理由去相信它给出的Predication. 这里,support & resistence是非常重要的。 过去的support & resistance, 表现的是市场参与者在那些价位的集中战斗的地方。 要想改变,就要有外力的支持。 而外力来的时候, price伴随volume break out, 又呈现的上升和下降的趋势。 那么,这里leader-->follower-->crazier, 形成了1-2-3的五浪图形。这些经典的东西,都是有它内在的道理。
3) TA不可能100%正确,能有>50%就很不错了。 想要成功, Money Management, 合理的Stop是及其重要的。 我反复说turtle group的Trend Following System, <40%的正确率,也是可以成功的。 追求100%正确,反而走向了另一个极端。
4)TA关键还是训练自己, 训练自己对市场的感觉,自己对Trading的心里承受能力。 最关键的是要consistent, 不能今天涨了, 用一套解释,明天跌了, 用另一套解释。
5)TA帮助我们制定Trading Plan, 制定合理的买卖点, 根据情况调整卖出点以保证Profit.
不能迷信TA, 但是要相信TA, 是工具,是信心。
Thursday, November 13, 2008
11/13/2008 再看SPY, 关注XLE
哎, 还是订不出trading plan, 不知盘如何走,stop如何设置。 盘不按照预想的走,应该如何应对。 如何能及时抓住出现的机会? 看来,还要继续练习看盘。
今天的stop point都很有趣, TIE, ICO都停在了前几天的support上面,其实,反弹也是有目标的。
XLE值得看一下, 有上升趋势建立的可能。

今天的stop point都很有趣, TIE, ICO都停在了前几天的support上面,其实,反弹也是有目标的。
XLE值得看一下, 有上升趋势建立的可能。


11/13/2008 V型大反转的反思
首先, 市场上的烂消息是一个接一个, 今天的反弹只是触底反弹, 虽然DOW没有破10/10的low, 但是, SP500和NAS都是今年的新低。 所以,市场出现了强烈反弹。
1. 反弹总会发生,但没想到这么快,这么狠。 但是,看一下下面的SPY 5分钟图,在看一看Volume, 不难发现, 其实,还是有很经典的bullish 信号。 这里,我们不应该胡乱猜底部,但是,到了底部反弹是,图形上会给出信号。 这可以说是一个buy on break out的例子吧。

2. 反弹会有多远。图上不难发现,1点反弹, 2点,3点各有pull back. 非常均衡的1-2-3push。
3. 止损的设置。 前几天看跌,完全是正确的。 但是,现在的市场,Volatility太大,大波来的时候,发生的很快,如果没有Trailing stop的保护,Short Position在几个小时里面,就灰飞烟灭了。
4. 10/10发生了同样的反弹, 但是,市场花了一个月的时间,又回来溜达了一圈。 今天这个点位,是个铁底部,只要没有什么大公司倒下,如GM, GS之类,可能,就是个中期底了。 但是,这一个月, 发生了更多更坏的消息, 很多,对经济的影响还没出来, 中期也还在一个下跌Trend里。 相信,回调很快就会发生, DOW的9600, SP的1000, 应该还会是个顶部。 市场应该在这个区间继续震荡,知道更大的事情发生,才能突破。
Wednesday, November 12, 2008
11/12/2008: Sector Divergence
从今天来看, 10/10, 10/27, 11/12, 三个低点, 10/14, 11/04的两个高点, 对比个个sector。
Financial: XLF竟然是下降通道, lower low and lower high 啊。
Technology: XLK,Consumer XLY, 都和SPY差不多,
其他的,好像还是三角型, 11/12并没有touch 10/27的低点。
XLU, Utility Sector, 竟然是个上升形式, 呵呵。回头查查Utility的公司。


Financial: XLF竟然是下降通道, lower low and lower high 啊。
Technology: XLK,Consumer XLY, 都和SPY差不多,
其他的,好像还是三角型, 11/12并没有touch 10/27的低点。
XLU, Utility Sector, 竟然是个上升形式, 呵呵。回头查查Utility的公司。


11/12/2008: 三探底部,新低可待, SPY图

都写在图上了。 看图吧。 主要有一点, 最近学的TA方法,全印证了。 可能,很多trader都这么用吧,不然,怎么这么巧合呢。 而且, 我看到信号以后,准备动作了, 时间价位就过了。 以后,需要进行假设,如果价位如何,就会产生什么信号,就应该怎么处理。 单子提前等着,满足条件,就trigger了。 另外,设好stop, stop的点要完全否定entry点的假设。
11/12/2008: 重回最低, 新闻? 还是不可避免?
为什么会有那六天18%的涨幅,我不明白,可能,在这种市场条件下,没坏消息,就是好消息。人们是健忘的,股市也需要反弹,而且,也需要把更多想抄底的人套进来,才能更好的下跌。
这几天的坏消息,一个接一个,难道只是新闻么?
今天Best Buy说是“most difficult climate ever", CC倒闭,是因为和BBY竞争么? 还是因为本来就是很艰难的时期,大家都不好。 CC只是撑不住了。
随着大家的钱都套在房子,股市里, 随着layoff 的增加, 消费怎么会好的了? 现在,有一个好消息能使房市不下滑,能使layoff减少么?
中国的政策,显然是要趁机脱离对美国经济上的依赖。
总说市场是对今后6个月的经济的表现,我到觉得,市场根本就很迟钝。
大家想着Year End Rally, 新总统效应。 呵呵,等着1月份的ER出来,10月到12月的layoff情况反映到ER里,估计还有一波血洗。
更严重的情况,美国没有什么实际的经济动力。 就算09年尘埃落定,撑不住的公司都倒掉,一切从组了,能反弹到那里? 5年内,面对中国的挑战, 美国的经济,恐怕会长时间没什么增长。 而股市,只会在一个范围内长期徘徊。
大胆预测一下,7500-12,000
11/12/2008: 清早,又是一波坏消息
Here is the list from marketwatch, cnn and Yahoo:
1. Worst of times for Best Buy
No. 1 electronics retailer slashes profit outlook, citing major fall-off in consumer traffic and purchases starting in mid-September.
2. Loss-making Macy's cuts capital spending
3. Mall operator warns of bankruptcy threat
4. American Express seeks $3.5B from feds - report
5. Sun gambles big as outlook darkens
6. Oil slips below $59 on growth pessimism
7. U.S. mortgage plan falls short
所以, 这几天守的support很可能成为短期的一个resistance. DOW@8700.
Tuesday, November 11, 2008
11/11/2008: 又是上下翻飞的一天
市场终于明白了, 这个经济烂的不行。 DOW低开了200点, 有跌了150点,才缓住。 不过, 2点的时候突然反弹了一下,但迅速拉回, 手盼在-200点左右。 看图。
GM今天跌了-14%, 收在了2.92. 这样,三天从4.8 跌倒2.92, 目前,等着政府救援。
GS跌破IPO价格,迅速反弹了10% 左右, IPO价格,是否是一个strong support呢? 继续关注GS。
BBY随市场小跌。
TIE破了8.5的support, 在8.2徘徊, 收到了8.32, 8.5 成了resistance.
ICO新低,到2.8了,而JRCC也到了8.85. 这个油价跌, 导致这个能源板块下降,其实,对经济是促进,可惜,街上的解释是中国经济放缓,需求降低,油价下降。 好吧,降吧。

GM今天跌了-14%, 收在了2.92. 这样,三天从4.8 跌倒2.92, 目前,等着政府救援。
GS跌破IPO价格,迅速反弹了10% 左右, IPO价格,是否是一个strong support呢? 继续关注GS。
BBY随市场小跌。
TIE破了8.5的support, 在8.2徘徊, 收到了8.32, 8.5 成了resistance.
ICO新低,到2.8了,而JRCC也到了8.85. 这个油价跌, 导致这个能源板块下降,其实,对经济是促进,可惜,街上的解释是中国经济放缓,需求降低,油价下降。 好吧,降吧。

Monday, November 10, 2008
11/10/2008, TIE @ 8.5
Ok,$8.5 is a support, $9.2 is the resistance. 连续4天如此,看来,如果没什么大风吹,这个区间,还是挺容易来钱的。呵呵。


开始关注GS, GM, BBY
GS是投行的旗舰,但是,最近一直下滑, 开始严重亏损,到底亏多少,没人知道。 而且,Paulson可能下台, Obama政府会不会为GS买单,还是另一会事情,应该严重关注事情的发展。适当可以防火了, 呵呵。
GM现在在垂死的边缘, 上周五只跌了11%很奇怪,今天果然跌了22%。 哎, 为什么不落井下石呢?
Circuit City终于破产了, 哎,虽然ld经常说,CC里面,雇员比顾客多很多,可是,还是没意识到,这其实是CC不行的征兆。同样的例子,ld说,Lines and Things不能和BBB比,东西特别贵, 但也没有转成投资的概念。 如果看不明白那个店好,ld说那个店不好,还是可信的。呵呵。 所以,Best Buy是CC的老牌对手,CC到了,一家独大, 关注一下吧。
三张图。


GM现在在垂死的边缘, 上周五只跌了11%很奇怪,今天果然跌了22%。 哎, 为什么不落井下石呢?
Circuit City终于破产了, 哎,虽然ld经常说,CC里面,雇员比顾客多很多,可是,还是没意识到,这其实是CC不行的征兆。同样的例子,ld说,Lines and Things不能和BBB比,东西特别贵, 但也没有转成投资的概念。 如果看不明白那个店好,ld说那个店不好,还是可信的。呵呵。 所以,Best Buy是CC的老牌对手,CC到了,一家独大, 关注一下吧。
三张图。


11/10/2008 中国在行动, 看好中国!
今天DOW高开了几乎200点,不过,一路下滑,以-72点收盘。 回顾今天早上,我就觉得中国的刺激计划其实对美国经济的挑战,脱离,而不是救援。 因为中国现在过分依赖出口,导致美国经济下滑,中国出口企业面临倒闭和大规模失业。 中国的领导人,应该是意识到这一点,所以,与其把钱借给美国人花,不如投在自己的基础建设上,出口企业受影响的劳动力,转移到自己国家的建设。 让美国自己自生自灭。同时,把经济的主导权掌握在自己手里。
未来5-10年,基础建设有的是地方,换来了时间, 可以同时加快消费经济,缩短技术企业的差距。所以,这个4万亿的计划,其实是对美国的挑战。 中美之间的博弈,正在火热的进行中。
对于投资者来说,我更坚定不移的看好中国市场。也是时候,进行对中国长期投资的时候了。
未来5-10年,基础建设有的是地方,换来了时间, 可以同时加快消费经济,缩短技术企业的差距。所以,这个4万亿的计划,其实是对美国的挑战。 中美之间的博弈,正在火热的进行中。
对于投资者来说,我更坚定不移的看好中国市场。也是时候,进行对中国长期投资的时候了。
DOW 的100年
谢谢,没有数据,只有图,不过,从图上看:
1. 平滑期, 15年
1901--1916: 主震荡区间, 50-70。
1901/06 DOW 57, 1915/03 DOW 57
2. 上升期:13年
1916 -- 1929: 60---382, 14.5% APY
3. 恢复平滑期: 20年
1930-1950:主震荡区间, 50-70。100-200
虽然有1932的低点, 但太低了, 这期间还经历了两次熊市, 不过,以150点为中心,上下震荡。
1934 DOW 110, 1950 DOW 163.
4. 战后高潮期: 16年:
1950-1966: 161---995, 12% APY
5. 越战痛苦期: 15年
1967--1982:主震荡区间, 700-1000。
1967 DOW 744, 1982, DOW 766.
6. 新科技发展期:18年
1982-2000:750 --- 12,000 , 15%APY
7. 小布什胡来期:
2000--- 2015???? 主震荡区间, 7,000-12,000???
2000 DOW 12,000, 2008 DOW 9,000.
=======================
8. 新能源爆发期:2016--2030????????????????????????????
哈哈哈。
11/10/2008 写在中国$586B经济刺激计划的早上
中国出台$586B, 或者是4万亿人民币的经济刺激计划, A股涨7.2%. 其实,中国的股市应该涨了,虽然,这种基建短期有效果,长期,还要看消费经济,但总是好的应该。
而对美国这边,能有什么呢? 加大参与中国的基建计划?好像High Tech成份不多? 看一看今天早上CNBC的一些标题吧:

几乎没有什么好事情,联想上星期的job cut等消息, 加上Friday就要出来的consumer spending data. 感觉是暴风雨前的平静,而不是绝地大反攻。
当然,也可能,最坏的情况已经过去。 可惜,我总是想不明白,CC倒闭, 19个bank fall, 金融机构一个接一个的扩大亏损, 三大汽车濒临倒闭, job loss几乎record high,hedge fund 在挣扎... 这些都是10月, 11月的事情,对经济就没有负面影响?
Anyway, 中国这个计划,就算是寒冬的第一股暖风吧。
多年之后,当一切都明白了, 回来看我今天的Fear, 兴许才明白,什么时候应该greedy, 兴许才明白股市和经济到底是超前还是滞后的关系。
Sunday, November 9, 2008
10day SPY and TIE, Waiting to see


I guess my conclusion is up or down at 50/50. I have to wait to see how market moves. I don't know how other indicator do. It is time to analysis other indicators.
Well, will write another post about my feeling of price action and indicators.
11/09/2008 Job cut, Consumer shrink, Hedge Fund Pain
Well, with more and more job cuts, the consumer spending will likely to be really bad, the data expected to come out on Friday. Here is the headline on marketwatch:
1."Retail returns to the 1970s
Sales likely to mark fourth straight decline for first time in decades "
"Worst retail sales trend since 1974 expected
Fourth consecutive month of declines seen; sentiment, trade data on tap."
2. Hedge fund managers 'funereal' in midst of crisis
"More pain expected, but some look for opportunities in 'rubble'"
"In the midst of the worst financial crisis since the Great Depression, several top hedge fund managers sent a grim message to their investors in October: it isn't over. "
Although, some funds manager are buying because of the opportunity. I guess this is the fight between bull and bear then. Let's see who will win.
3. The Great Stimulus of China
"Over half a trillion dollars to be spent on major infrastructure projects, tax reform, housing and other items in effort to spur economy."
Our motherland start new "扩大内需“, building infrastructure again. China's economy has to be independent on US. Otherwise, it will never grow. Well, not sure "扩大内需“ is the permenent solution or just temporary boost. So many people need jobs... Anyway...
So, still , I didn't see any sign of turning around. We are still sliding downward. But the "predictive" stock market seems already sense the bottom will happen in next 6 month, and start going UP UP, and is about "AWAY"?
Question is, event if 8200 is the ultimate bottom, where can it go? 14,000? Or 20,000? Or just like the 70s?
Anyway, these question I will never have an answer, the only thing I can do is to watch.
Saturday, November 8, 2008

周记11/3/2008--11/9/2008 新总统的Volitility
11/4日,美国又创了历史,Obama以2:1的比分,赢得的美国总统,8年的布什统治终于结束了, 而共和党也为此付出了沉重的代价。 第一位非洲裔的黑人总统,明年一月就要登上历史舞台了。也像世界证明,美国什么都是可能的.
人们希望,新总统能带来经济的复苏,但愿, Obama布什一个只耍嘴皮子的人,还是让我们带着怀疑和谨慎的眼光看吧。
不过,Tech时不时改复苏了呢? NAS现在只有不到1700点, 8年前的5000点什么时候才能回来?
股市也是上下翻飞, 周一周二,继续上扬,收复失地, 到了50%的重要阻力。 周三, 市场没有给Obama面子,下跌5%, 周四,继续下跌5%。 其主要原因, JOB LOSS。
周五, job report 出来,
人们希望,新总统能带来经济的复苏,但愿, Obama布什一个只耍嘴皮子的人,还是让我们带着怀疑和谨慎的眼光看吧。
不过,Tech时不时改复苏了呢? NAS现在只有不到1700点, 8年前的5000点什么时候才能回来?
股市也是上下翻飞, 周一周二,继续上扬,收复失地, 到了50%的重要阻力。 周三, 市场没有给Obama面子,下跌5%, 周四,继续下跌5%。 其主要原因, JOB LOSS。
周五, job report 出来,
“On Friday, the Labor Department reported that the U.S. economy sloughed nearly 1.2 million jobs through October. Just in the month of October, the economy lost 240,000 jobs, raising the unemployment rate to 6.5%.”
Worst in 14 years! And CNN money的标题是:
“Layoffs hit every corner”
The problem with job loss is very very bad in this market. 因为这场危机的根源,在房价! 可是,随着job loss 的增加, 房价只能在降, 然后,更多坏账hit 金融机构, 一个无限正反馈,知道大家都破产为止。
政府的天价赤字,加上GM, Ford面临破产,GM和Ford, 三个越就loss了7个Billion, 而GM说连一个Quater都撑不住了。 大家等着政府救援。 救么???
救? 钱那里来?借着印钞票?
不救?好吧,1百万人失业, 我看你怎么办???
Well, guess what. 周五,股市上下翻飞了几次,竟然涨了3%。 好吧,先知先觉们早把这些计算进去了??? 连GM也只跌了11%?
所以,我只是一个土鳖,永远看不明白, 不明白。 呵呵,不明白,我就接着看,接着看吧。
Dow: 9,336.93 -- 8,943.81 -4.2%
SP500: 968.75 -- 930.99 -3.9%
NAS: 1,673.32 -- 1,647.40 -1.55%
Thursday, November 6, 2008
11/07/2008, TIE Play
Well, On Tuesday, we sold all of my TIE shares around 10.5. The closing price is 10.55. All I am thinking is TIE will fly to 12 then 14 in 2 weeks. How should I refine the trailing stop strategy to stay in the trend to long.
But as stated in the SPY post, it has been up 50% in 6 days. A pull back is needed. Also, 10.6 is a strong resistance, a pull back at the level is very very likely.
So, Tuesday, I should make up the plan, if it would be down, should I buy or should I sell?
End of yesterday, I identified 8.5 is a strong support. All I am thinking is to buy on that support.
Why shouldn't I sell short at the beginning of today?
Why did I watch and waiting for it drop to 8.5?
Why didn't I ask myself, even it dropped to 8.5, it that a strong rebounce point? Currently, the long term trend is DOWN, the winning probability is in favor of short.
If I did buy at 8.5, today's close is 8.65. What will happen tomorrow? How far did I expect it to rebounce to?
But If I short at open around 9.1, things are much different, I can plan 8.5 to cover. Or I can hold it overnight. This would be a much favorable situation than buy on the weak support of 8.5.
Combine with overall market analysis, we should short starting from yesterday!
Anyway, now, what should we expect and what should we do?
At this level, we might have a bounce back to 9.1 level or even 10. I think we can prepare another short later. Or we should wait around 7 to buy on the stronger support. At this level, it is sort of in the middle. Win/Loss is around 50%. Let's just wait.
Remember: SHORT in DOWN TREND, and LONG on UP TREND is better. Counter Trend should be fast in and fast out.

11/07/2008 从SPY看大盘
两张图, 第一张是SPY2个月的图, 其实呢,从前天大选结束后,已经有多个下跌的信号。
1. 市场连涨6天, 18%的涨幅, 至少需要调整一下。
2. 正好涨到了38.2%这个迷信的阻力位置, 从Vol By Price来看, 也是在阻力附近。
3. 大家都出水了,牛气开始冲天。
4. 我们在长期熊市,从此的牛气, 还是不正常的,这样想,昨天该跌。
哪么,这两天下跌, 是上升调整,还是继续长期Trend? 个人认为,是继续长期下跌Trend. 这是由long term trend和这两天下跌的经济原因为背景的。主要是就业数据,long term unemployment 是25年high. 6个月的short term unemployment继续攀升。 这样看,我们应该再次探底。
第二张是10天的图, 也就是说, 涨6天,跌2天,就retraces了61.8%, with larger volume.
当然,这个点也可以看成support, 明天反弹,只是,在这样的熊市上,如果没探原来的底部就反弹了,我们就有了第一个higher low, 如果突破101, 甚至突破105,到109在回调,就有了第一个higher high. It is too good too bullish to be true inthis market.
I will vote down to retest bottom.
=============
其实,TA猜测趋势,只走完了一步, 另一步,是根据情况制定trading plan:
1. If tomorrow down, should I short? Or should I wait the old bottom to buy the rebounce?
2. If tomorrow is up, should I buy? Or should I wait for the next resistance to sell?
实际上,昨天早上,是short的最好时机,只是,大选日的疯涨,能冷静看跌,并且制定出,“If tomorrow down, short!"的plan, 还是需要勇气的。


Intermarket analysis
Intermaket analysis is very very valueable. Because some sector might lead other sector. How should we identify them? Here we have some basic ideas.
1. Commodity with sector stock.
Crude Oil --> Oil Industry and Transportation, Steel Price --> Steel Industry, Wheat --> Food Industry. And so on and so forth. CRB index with inflation, Tbond. Commodity strong might indicator overall economy goes up since the raw marterial has higher demand.
2. Big Money
Currency like US Dollar index, Inflation CPI Index, T-Bond Price, Interest Rate, GOLD.
Some one take the currency adjusted Gold price, may get different conclusion on gold trend predication.
USD up might benefit small/mid us company but hurt big internation company.
3. Stock groups
We should look at sp stock sector groups, also, we can monitor Fidelity selected sector fund as well.
First, we need to get all the index, find their normal relation ship. Study who correlates who, positive or negative. When they decouple, what does it mean. Such as TBond and Stock market decouple, there could be panic on the market that all money goes t o TBond for save heaven.
This will help us identify the direction of the overall wind in the market. Also help us find trend reversal earlier than we could notice.
More more work to do.
Trend, Consolidate & Reversal
Market in 3 mode, not matter time frame. It is either trending or consolidating, after consolidates, it reverse.
To be a successful trader, we have to recognize the long term/mid term/short term trend, and find support/resistance level, then make up a valid trading plan with high probability.
A good trading plan should consist the following:
1. Current trend analysis.
2. Trading time frame.
3. Trigger condition with strong reasons
4. Stop loss which invalidate reason of entry.
5. Mental preparation to stick with the original plan.
6. Adjust stop loss with market goes the way as expected to protect profit.
It is all sounds very very easy, but how should we identify trend, support and resistance, possible reversal, and time/price of entry?
1. What is a trend.
The basic idea of trend is higher high and higher low for a up trend, and lower high and lower low for a down trend.
Or someone might say it is above MA to be a up trend.
With any definition, a trend is very easy to identify even with just one glimpse on the chart.
The problem is "Do you want to trade against the trend or with the trend"? Both are valid as long as you can enter the market with valid entry point.
2. Reversal
When the market is consolidating, it normally come with higher volatility and high volumn. Is this really true? Or maybe it is only happen for the beginning of the trend stop, after some time, the market goes sideways with low volatility until it break out.
Sometimes, the wave theory gives a 3 push leg. Exhaustion gap after long run might be the early sign of reversal.
Another point, is the strong right. In other words, when the reversal comes, the right side leg should have heavier volumn and sharper rate than the left leg. The stronger, the more posibility that the trend will reverse. Yes, that is true, because both leg trade on the same trading range, and more volumn vote to the reserved direction on the right leg.
One thing for sure, the market can not go on one direction for sure. When signs of reversal is coming, we might want to tighten the stop to be close to the high to protect profit.
3. Time frame
Time frame is very important, some time the long term (>6mo) is up, mid term (2mo) is down, short term (10day) is up. Depending on the time frame, we might take different strategies. Also, we might view support and resistance differently. Be specially cautious when trading against the general long term trend.
4. Trigger conditions.
There are some many indicators out there. But there is absolutely no "Holy Grail". From the classical indicators, to the Elliot Wave theory, to action/reaction swing calculation. But one thing we can be sure, if many indicator happen to point to the same thing. We have higher probability. All we need is higher probability to win.
With high probability + cut loss short, we have better chance to survive in the market.
Modern market use a lot of ETF. I would think trade the stock with the same direction of sector and over all market would be better. It just like you sail on the ocean, you want the wind to push you instead of sail against the strong wind. The sector and overall market trend is the wind, which will affect the individual stock.
Furthur more, we might want to choose the stock that have even stronger trend than its own sector and market. Let's call it trend leader.
With trend leader, plus proper buy on support, sell on resistance strategy, I would think there are better chance to win.
Well, how to identify proper support and resistance, I don't know. Hahaha... will keep learning.
5. Mental Preparation.
Should we trust TA? What TA can provide us? I didn't believe TA for quite a long time. But now I think TA has its value.
First, TA is a summary valid expierenc of past 100 years. So far, all what we can see have under gone the test of 100 years. We are lucky.
Second, For TA, we should understand the fundermental behind each pattern, it reflects human nature, this is one thing that will never change. And this make the same stock market story repeat again and again.
Third, Most of the traders nowadays, look at the same chart, read the same book. They agree with each other. No one is really smart than the others. If most of the trader agree certain point is the support, it will be the strongest support. We just have to train ourself to be consistent with the traders that has big money. That is all.
If we believe our TA, we should stick to the analysis, and stick to the plan. Be positive, don't be sad when losing money, summary what went wrong in the analysis. Don't be overly happy when we are right, always be cautious and protect the profit.
Wednesday, November 5, 2008
关于止损点的设置
无意间看见了一个网站,tv.ino.com, 上面一个free presentation讲exit strategy的, 总结一下吧。
1. Exit determine trading out come.
This is really true. How should we set proper exit? Should we protect our profit, also, at the same time, stay in the trend as long as possible? This sounds easy, but actually difficult.
The guy also mentioned that he tried random entry, turns out that the result is not bad at all using a better exit strategy. See, random entry, interesting concept.
Also, exit controls our profit, loss, duration of the trade and number of the trade.
2. Average True Range. (ATR)
He loves ATR. The defination of ATR of the the max difference between previous close and today's high or low.
True Range = Max of (ABS( High(N) -- Close(N-1)), ABS( LOW(N) -- Close(N-1)))
Then we can have MA on everyday's true range. This represents the recent volatility.
3. Type of exits
3.1) Exit using ATR
Depending on the risk tolenrance, we can set trailing stop around 4xATR(20 day). He call is chandlier type exits. Like a chandlier hanging to the high of the roof.
3.2) Channel exit.
Using lowest low of N day.
3.3) MA stop
He mentioned combine with ATR to avoid sudden volatility.
4. Combine all types of exits.
Exits are hard. When people lose money, they want the stock to go back. When people earn money, they want to earn more. Without a proper exit strategy, there is no long term winning in the stock market. Always set a exit before TRADE!!!
5. My own feeling.
I think we also should set exit according to our own judgement of the stock trend. If we buy around a major support, we should set the stop to the location so that if the stop is hit, the up trend might be over and a down trend will begin. I know it is hard. But the initial stop is hard, other than loss control, there better to a reason to stop.
One word, the initial stop should indicate the supporting reason of the entry is invalid.
After the trend goes the way we expected, we need to estimate how far it can go. And ajust the exit accordingly, to protect the profit and stay the trend longer if we can. Here we will need more study on trend reversal indicator. Will study later.
1105/2008: Obama Win, Stock Down 5%
Well, today's economic news are: (From Yahoo Finiance)
0) Obama Win the election
1) According to the ADP national employment report, nonfarm private employment declined by 157,000 in October, which is the largest decline since 2002. The result was worse than the expected drop of 100,000. September was revised to a decrease of 26,000 from a decrease of 8,000. The ADP data have had a spotty track record compared to the government's report, which includes both public and private nonfarm payrolls, and is set for release on Friday.
Let's look at last 2 month of DOW.

2. TIE Play
TIE up from $7 to $10.8 yesterday. Up 50%. I have 4% trailing stop set yesterday. It was trigger around $10.42. The low is 10.3 and closing is 10.55.
By the end of the day, I have no idea if it should go up or down. But since it is up 50%, also 10.62 is the 61.8% retracement from previous high of 13.2 to previous low of 6.5. Probably a high probability to tight the profit taking stop.
Look at the 2 month chart. The next visual support is around 8.5 - 9.0 area. Today, it close at 9.47.
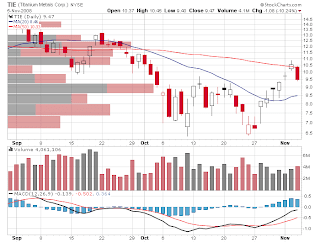
From 10day chart, 8.5 is a good support. volumn by price is high around that area. Also, 10day low is 6.5, high 10.8, 50% retrace level is 8.65. 61.8% is around 9.15. So if break 9, we probably can buy some around $8.5? Or should we back to $7 area?

0) Obama Win the election
1) According to the ADP national employment report, nonfarm private employment declined by 157,000 in October, which is the largest decline since 2002. The result was worse than the expected drop of 100,000. September was revised to a decrease of 26,000 from a decrease of 8,000. The ADP data have had a spotty track record compared to the government's report, which includes both public and private nonfarm payrolls, and is set for release on Friday.
2) The services sector contracted by the most since at least 1997 and the sixth time this year, according Institute for Supply Management's national nonmanufacturing survey, which dates back to 1997. Specifically, the October ISM Services Index registered 44.4 in October, 2.6 worse than expected and 5.8 lower than the 50.2 reading in September. A reading below 50 is intended to imply contraction in the services sector.
3) Goldman reduce bonus, begin 10% jobcut, that is about 3200.
===================================
Ok, let's look at the stock market
Let's look at last 2 month of DOW.

2. TIE Play
TIE up from $7 to $10.8 yesterday. Up 50%. I have 4% trailing stop set yesterday. It was trigger around $10.42. The low is 10.3 and closing is 10.55.
By the end of the day, I have no idea if it should go up or down. But since it is up 50%, also 10.62 is the 61.8% retracement from previous high of 13.2 to previous low of 6.5. Probably a high probability to tight the profit taking stop.
Look at the 2 month chart. The next visual support is around 8.5 - 9.0 area. Today, it close at 9.47.

From 10day chart, 8.5 is a good support. volumn by price is high around that area. Also, 10day low is 6.5, high 10.8, 50% retrace level is 8.65. 61.8% is around 9.15. So if break 9, we probably can buy some around $8.5? Or should we back to $7 area?

Subscribe to:
Comments (Atom)